AVR Debugging on Linux (with debugWire)
1. Debugger
At the time of writing (beg. of 2016), the old and discontinued JTAGICEmkII seems to be the best supported option on Linux, so I got myself a used one of those. The current Atmel-ICE Basic doesn't seem to work at all with AVaRICE because it uses a completely different protocol. Alternatives to the JTAGICEmkII are the AVR Dragon and possibly JTAGICEmkII clones like the ones from Kee Electronics and Waveshare. While both claim to be fully compatible on Windows, there is no statement on Linux compatibility.
2. JTAG and debugWire
Controllers like the Atmega328P don't support debugging via JTAG because of their
limited pin layout - they simply don't have the pins needed to connect them
to the debugger via the JTAG interface.
So Atmel has whipped up debugWire, a protocol allowing to debug over a single wire.
It is connected to the RESET pin, and it requires to disable the reset function
on that pin and enable debugWire, which is done by programming the DWEN fuse.
Please note the warning on programming the DWEN fuse in the manpage of AVaRICE.
While the DWEN fuse is programmed, the RESET pin has no function and thus the
controller can't be programmed via ISP until the DWEN fuse is unprogrammed again.
This can be done either via high voltage programming, or simply by unprogramming
the fuse with AVRDude.
3. Connecting the JTAGICEmkII
The JTAGICEmkII comes with an adapter from 10-pin JTAG to 6-pin SPI interface. The Quick Start Guide of the JTAGICEmkII, contains useful information on how to connect it.
When connecting the JTAGICEmkII via USB to the Linux PC, 'lsusb' should list it:
Bus 001 Device 046: ID 03eb:2103 Atmel Corp. JTAG ICE mkII
4. Compiling the code with debug information
For debugging to work, the code needs to contain debugging information
(g2 in stabs format) and it must be compiled without optimizations (-O0).
So the program could be compiled like this:
avr-gcc -Wall -g2 -gstabs -O0 -std=gnu99 -funsigned-char -funsigned-bitfields -mmcu=atmega328p -DF_CPU=1000000UL main.c -o main.elf
NOTE: Try compiler options -ggdb, -g and/or -Og (instead of -g2 and -O0) if execution doesn't stop at breakpoints.
5. Create a .hex from the .elf binary
As usual, the program needs to be flashed in hex format, which can be created like this:
avr-objcopy -R .eeprom -O ihex main.elf main.hex
6. Flash the program
The following command should do:
avrdude -pm328p -cjtag2isp -B10 -Uflash:w:main.hex:a
Setting the bit clock period (-B) to 10 fixed issues with random device signatures for me, probably caused by my suboptimal wiring.
7. Program the DWEN fuse
I'm using AVR8 Burn-O-Mat to program and unprogram the DWEN fuse, but of course it can be done on the command line, too.
8. Power-cycle the controller
Each time the DWEN fuse was programmed or the program was flashed, the controller must be power-cycled.
9. Start AVaRICE
The following command should do:
avarice -2 -w -Patmega328p -j usb :4242
Successfully started, AVaRICE should give the following output:
AVaRICE version 2.13svn20141210, Mar  6 2016 17:51:25

JTAG config starting.
Found a device: JTAGICEmkII
Serial number:  07:00:00:00:5c:3c
Reported debugWire device ID: 0x950F
Configured for device ID: 0x950F atmega328p -- Matched with atmega328p
JTAG config complete.
Preparing the target device for On Chip Debugging.
Waiting for connection on port 4242.
10. Start a debugging session with GDB
With AVaRICE up and running, it is now possible to start a remote debugging session from avr-gdb:
avr-gdb main.elf
The last two lines of the output should look like this:
Reading symbols from main.elf...done.
(gdb)
11. Connect to the remote target
(gdb) target remote localhost:4242
Remote debugging using localhost:4242
0x00000000 in __vectors ()
12. Set a breakpoint
To set a breakpoint in for example the function main() in line 77:
(gdb) break main:77
Haltepunkt 1 at 0x98: file ../main.c, line 77.
13. Start/continue execution until the breakpoint is hit
(gdb) continue
Continuing.
If execution doesn't stop at the breakpoint, try the compiler options mentioned in point 4.
14. Workaround for execution never stopping at breakpoints
It may seem a bit clumsy first, but it is a usable workaround: setting permanent breakpoints.
Permanent breakpoints can be set manually in the code using very simple inline assembly:
asm("break");
Obviously, the program must be recompiled and flashed. Then, after starting execution with "continue", execution will stop at the breakpoint(s):
Program received signal SIGTRAP, Trace/breakpoint trap.
main () at ../main.c:77
77              if (time > 0) { asm("break");
The value of "time" in this example can now be examined:
(gdb) p time
$1 = 1
Already quite nice I think!
Now when trying to step execution, GDB says:
(gdb) next
main () at ../main.c:77
77              if (time > 0) { asm("break");
The program is stopped at a permanent breakpoint, but GDB does not know
how to step past a permanent breakpoint on this architecture.  Try using
a command like `return' or `jump' to continue execution.
Jumping to the next line will let the execution continue until it hits the next breakpoint.
Obviously, it still is a shame if it is not possible to set breakpoints during debugging, but I think these permanent breakpoints have an advantage: you can let execution stop at them as often as you want without having to worry about at least two writes to flash done each time.
I might be wrong about this, but I'd actually prefer to think a bit about where to place my permanent breakpoints (and remove them again after debugging) and flash the whole program once, than writing to individual flash memory addresses many times. If the flash is worn out at just one address, the whole part is bricked, right?

1. Debugging in Eclipse
Most of the information here is based on the documentation at Debugging- AVR-Eclipse.
You probably already have the "Eclipse IDE for C/C++ Developers" installed already.
On top, you need to install the nice avr-eclipse plugin from here: Plugin Download and C/C++ GDB Hardware Debugging via Help -> Install New Software..., Work with: http://download.eclipse.org/releases/luna
2. Set up JTAGICEmkII as programmer
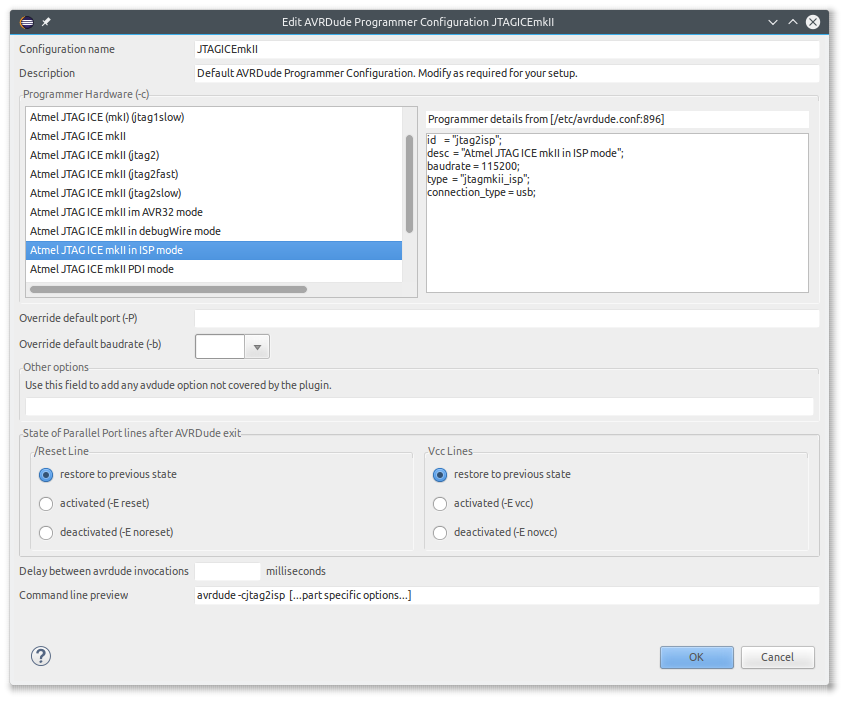
In the properties of your project, go to AVR -> AVRDude and create
a new Programmer Configuration.
Give the configuration a name and select "Atmel JTAG ICE mkII in ISP mode".
No particular settings have to be made.
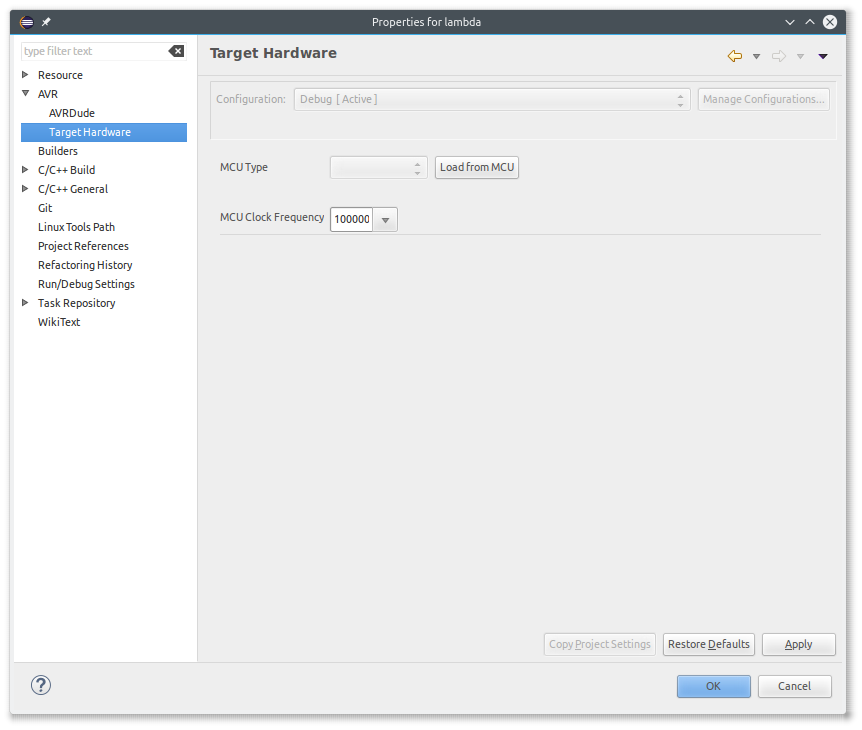
Go to AVR -> Target Hardware and at MCU Type, click "Load from MCU". This should succeed without error - nothing obvious happens.
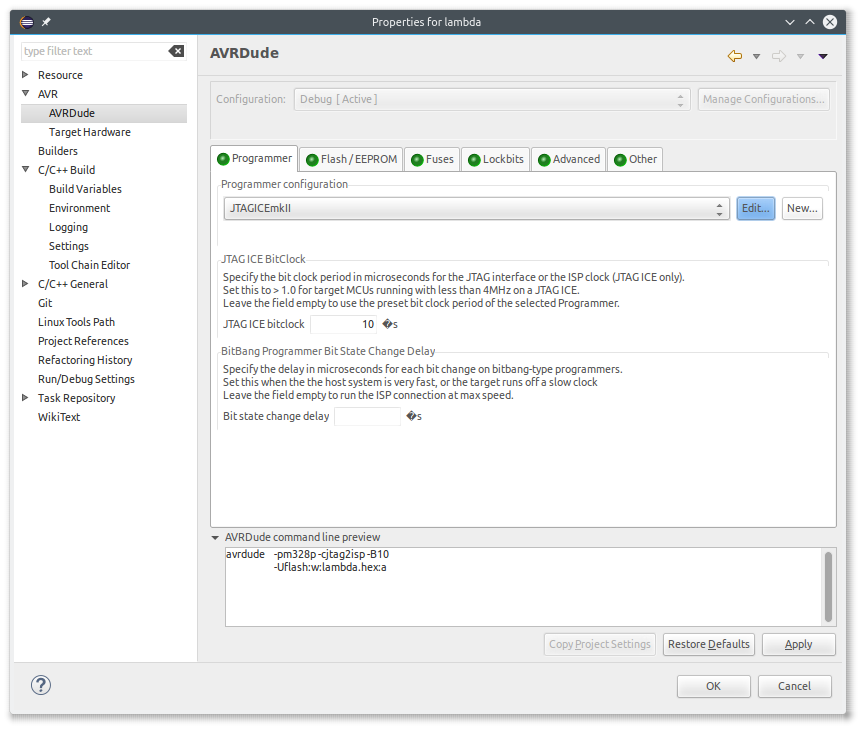
Go back to AVR -> AVRDude. The AVRDude command line preview should now include the correct device. I set a bitclock of 10, which fixed issues with random device signatures for me, probably caused by my suboptimal wiring.
Eventually, uploading the program should work by invoking the
 button.
3. Set up the Debug Configuration
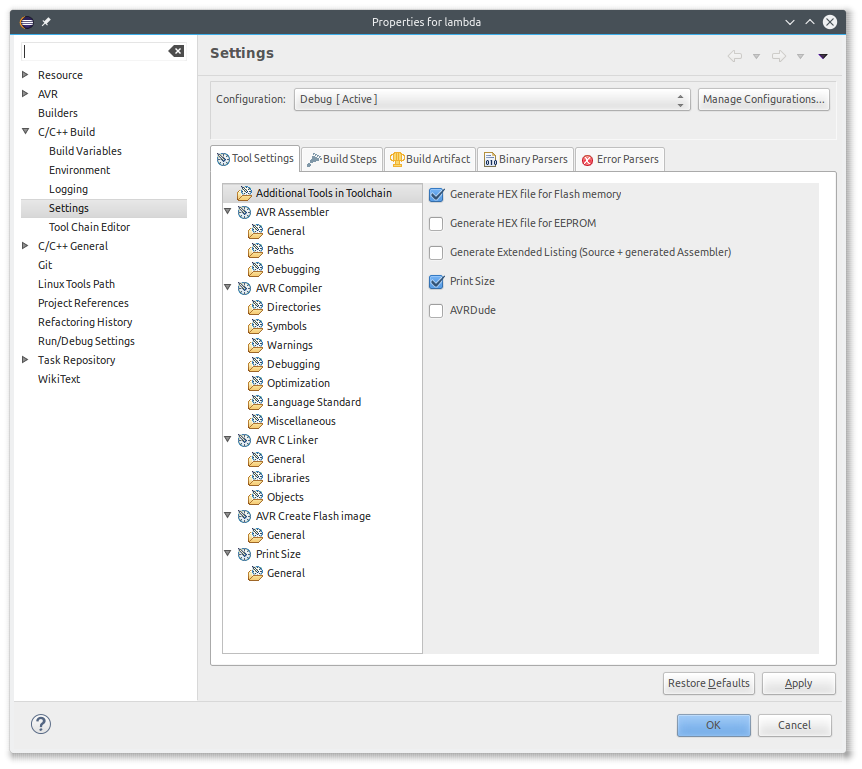
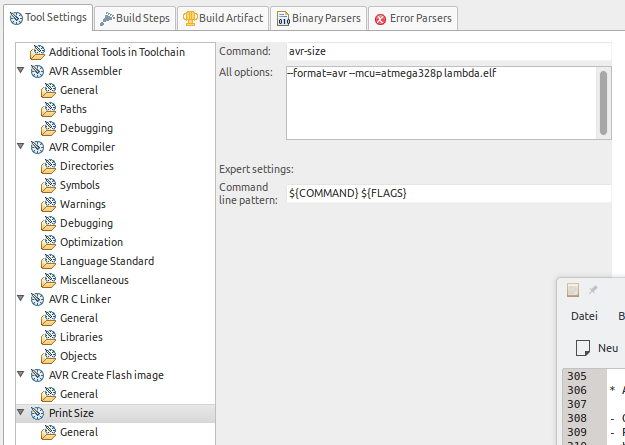
In the properties of your project, go to C/C++ Build -> Settings.
Additional Tools in Toolchain
- Generate HEX file for Flash memory: creates the hex file to upload to the controller.
- Print Size: just prints the size of the program in the console - interesting to see how big the program gets with debug information and without optimizations.
- Click "Apply"
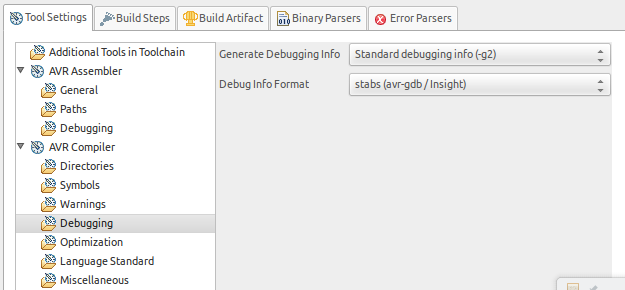
AVR Compiler -> Debugging
- Generate Debugging Info: Standard debugging info (-g2)
- Debug Info Format: stabs (avr-gdb / Insight)
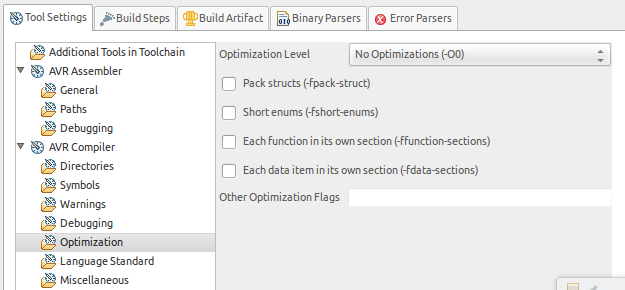
AVR Compiler -> Optimization
- Optimization Level: No Optimizations (-O0)
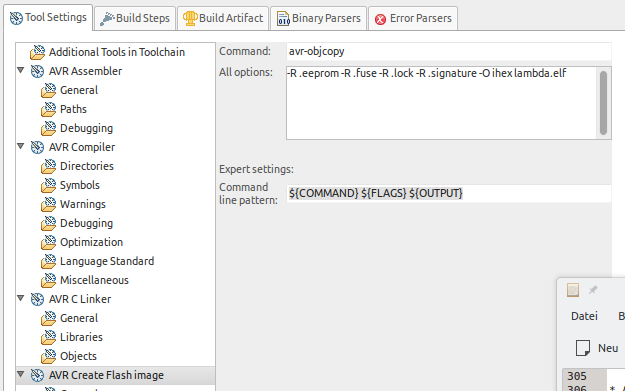
AVR Create Flash Image
- Command: Remove the leading "-" if there is one
- Command line pattern: Remove
Print Size
- Command: Remove the leading "-" if there is one
- Command line pattern: Remove
4. Run a Build
Now it should be possible to make a debug build of the project.
5. Flash the program
That should be just a matter of clicking the
button.
6. Program the DWEN fuse (if not done already)
The DWEN fuse can be programmed with for example AVR8 Burn-O-Mat.
7. Power-cycle the controller
Each time the DWEN fuse was programmed or the program was flashed, the controller must be power-cycled.
8. Create a debug launch configuration
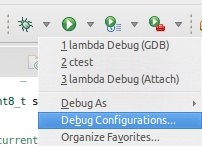
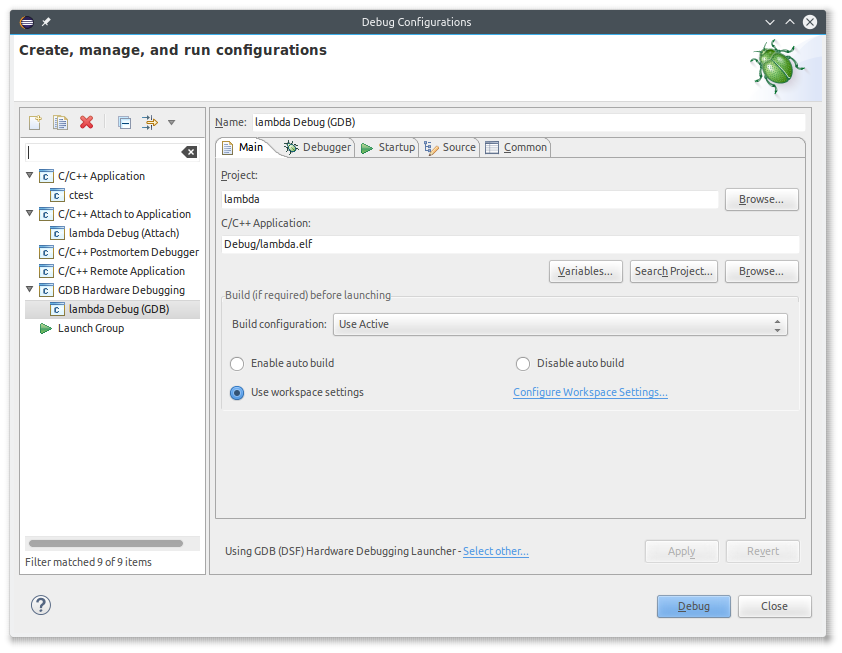
Main
- Click on "GDB Hardware Debugging" and create a new launch configuration
- Give it a name
- Check that the correct project is selected
- C/C++ Application: Should be Debug/yourprogram.elf
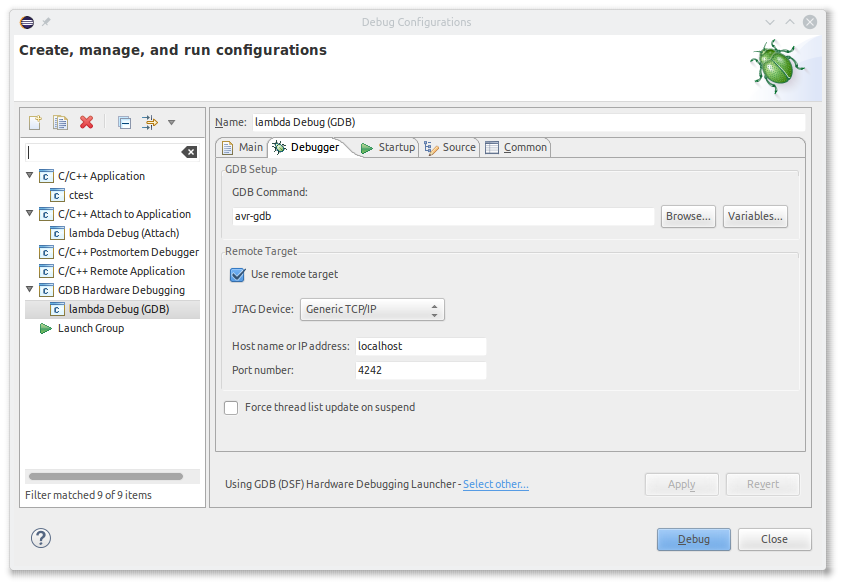
Debugger
- GDB Command: avr-gdb
- Use remote target
- JTAG Device: Generic TCP/IP
- Host name or IP address: localhost
- Port number: 4242
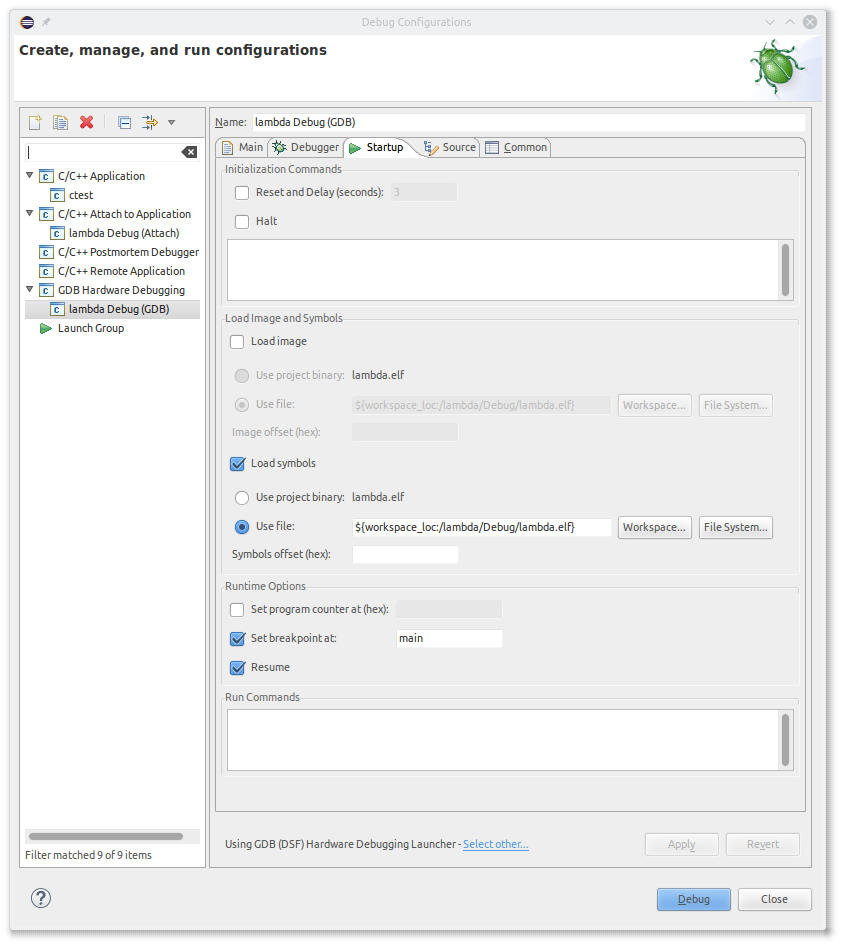
Startup
- Reset and Delay Uncheck
- Halt: Uncheck
- Load image: Uncheck, caused failure in AVaRICE for me
- Load symbols: Check this, without that Eclipse could not find the source during debugging
- Use file: Make sure it is Debug/yourprogram.elf with debugging information
- Set breakpoint at: Set main, should stop execution when entering the main() function
- Resume: Lets execution start until it hits the first breakpoint (main() function)
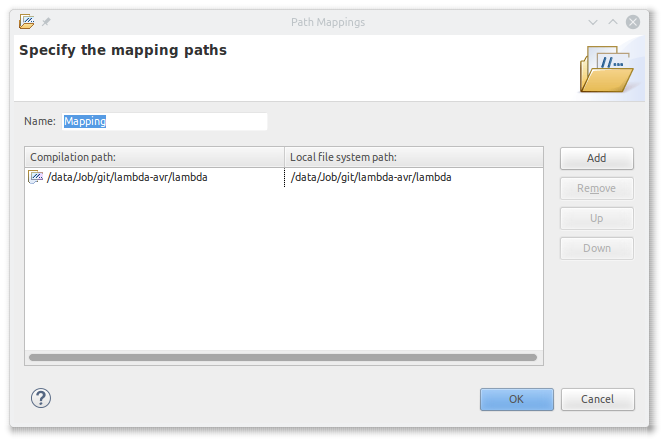
Source
- Source Lookup Path: I had to add a Path Mapping so Eclipse could find the source:
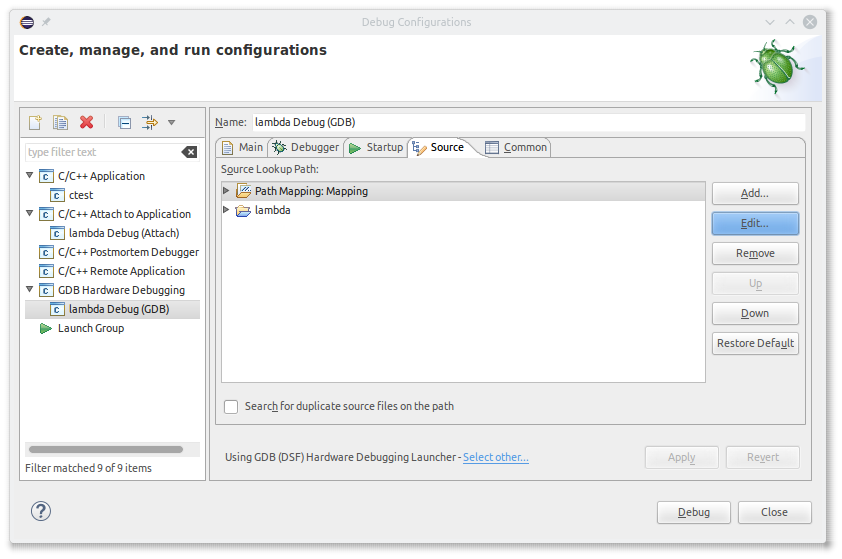
- Compilation path: <source directory>
- Local file system path: <same directory>
9. Start AVaRICE
This actually can be done from Eclipse as well. Check
Debugging AVR-Eclipse
on that.
I prefer to just start it on the command line:
avarice -2 -w -Patmega328p -j usb :4242
Successfully started, AVaRICE should give the following output:
AVaRICE version 2.13svn20141210, Mar  6 2016 17:51:25

JTAG config starting.
Found a device: JTAGICEmkII
Serial number:  07:00:00:00:5c:3c
Reported debugWire device ID: 0x950F
Configured for device ID: 0x950F atmega328p -- Matched with atmega328p
JTAG config complete.
Preparing the target device for On Chip Debugging.
Waiting for connection on port 4242.
10. Start a debugging session
Click on Debug
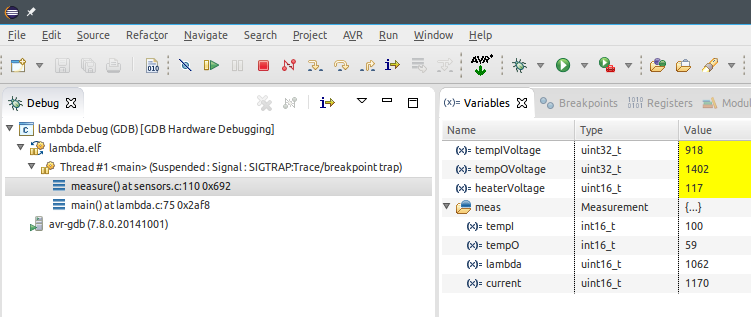
The debugging session should start and execution should stop at the entry point of the main() function.
If not, "14. Workaround for execution never stopping at breakpoints" describes a possible workaround.
By setting a permanent breakpoint, execution stops at the requested point:
In order to continue execution, invoking Resume (F8) or Step Over (F6) unfortunately won't do it, but it is possible to jump to the next line by typing
jump <line number>
in Eclipse's Console and execution continues.
Don't forget to remove all permanent breakpoints again before committing or flashing a "release"...
Comments? dode@luniks.net